End User Manual v2.1
The Storm Intersection Forecast Tool (SIFT) is an interactive visualization application developed to help operational planning for the CYGNSS satellite constellation. SIFT uses the Spacecraft Orbital Characterization Kit (SpOCK) to predict CYGNSS satellite and wind speed measurement (specular point) locations and displays them alongside key weather information and other information of interest.
Getting Started
Installing
SIFT is available on Windows (64-Bit) and macOS, and a *NIX version is coming soon. To install it:
- For CYGNSS team members, download the following directory from the CYGNSS's Linux server cygnss-sftp-1.engin.umich.edu to your Windows/Mac local machine: /data/cygnss/tools/sift/v2.1/{ win64 | mac }/CYGNSS-SIFT
- For non-CYGNSS team members, follow this link and refer to the document INSTALL_windows or INSTALL_mac, depending on your platform.
SIFT is written in Python 2.7.10 and a full listing of Python package dependencies for SIFT can be found in Appendix II. However, for CYGNSS team members, python packages ‘pyinstaller / py2app’ were used to create a standalone executables ‘sift.exe / sift.app’, which both include the Python interpreter and all runtime dependencies. Therefore, for CYGNSS team members, there is no need to install anything else before copying over CYGNSS-SIFT and running it.
SIFT is optimized for a screen resolution of 1920x1080. Lesser resolution will rely on the use of the scroll bars in order to see the entire SIFT display.
Directory Structure
The SIFT root directory is further divided into five folders in order to better groupe the various input/output files generated for and by SIFT. This section describes the purpose/contents of each subdirectory within the SIFT root directory.
sift/
├── code/
├── demo_input/
├── input_sift/
│   ├── <input_package>/
│   │   └── input/
│   .       ├── spock_in/
│   .       ├── gsCoverage/
│   .       ├── spec_positions/
│   │       └── storm_forecasts/
│   └── <input_packageN>/
│       └── input/
│           ├── spock_in/
│           ├── gsCoverage/
│           ├── spec_positions/
│           └── storm_forecasts/
├── output_sift/
│   ├── <output_package>/
│   .   ├── screenshots/
│   .   ├── cygnss_gs_reports/
│   │   └── cygnss_overpass_reports/
│   └── <output_packageN>/
│       ├── screenshots/
│       ├── cygnss_gs_reports/
│       └── cygnss_overpass_reports/
├── doc/
└── sift.log
| Directory/File | Purpose |
|---|---|
code/ |
Contains all SIFT *.py and SpOCK. Files in this directory should not be altered nor moved, to maintain stable operation. |
demo_input/ |
Contains SIFT inputs for demo runs. Files in this directory should not be altered, but additional demo packages can be stored here if desired. |
input_sift/ |
Contains all SpOCK output to be used as input to SIFT. Inputs packages will automatically be named according to the start/end date of the package. Each input package contains five folders at the input_sift/<input_package>/input/ level, namely spock_in/, gsCoverage/, spec_positions/ and storm_forecasts/. These folders contain the various files generated by SpOCK which serve as inputs to SIFT. |
output_sift/ |
Contains any screenshots or reports generated by SIFT during normal operation. Like input_sift/, this directory contains subfolders automatically named according to the start/end date of the input package that was running when the output was generated. |
doc/ |
Contains the installation files and this user manual. |
sift.log |
Logs info, warnings and errors during normal SIFT operation. |
Propagator: SpOCK
SpOCK is the tool that runs in the background to predict the trajectories of the CYGNSS constellation and the positions of the specular points. SpOCK is a highly accurate orbit propagator using comprehensive modeling of the perturbing forces acting on a spacecraft, in particular atmospheric drag. This allows for an accurate prediction of the CYGNSS and GPS satellite trajectories. From the positions and velocities of the two constellations, SpOCK then derives the locations of the specular points. SpOCK also computes the coverage of ground stations by the CYGNSS observatories to predict when the wind speed measurements can be transmitted to the ground. SpOCK is written in C and supports parallelism, which makes it well suited for constellation analysis (Bussy-Virat et al., 2018(a)).
The positions of the CYGNSS satellites and the specular points, as well as the coverage of ground stations outputted by SpOCK are used as inputs by SIFT.
SIFT was designed so that users have the least amount of work to run it. This implies less flexibility, though. In particular, users can't change the way SpOCK runs in the background. For example, the users may want to change parameters such as adding a ground station, changing elevation mask or, modifying propagation parameters (attitude of the satellites for example). If users wish to do so, they can contact cbv@umich.edu.
With v2.1, the predictions of the specular point locations by SpOCK are more accurate. ~95% of the specular points are correctly identified (i.e., same PRN as the on-board algorithm). The position error is a few km and almost does not grow with time.
Normal Operation
Under normal SIFT operations, the end user specifies an analysis interval start/end and SIFT automatically invokes SpOCK to generate necessary input files as well as download relevant storm forecasts.
To run SIFT in this way, navigate to code/ and execute:
$ ./sift.exe
$ ./sift.py
A prompt should appear asking for an analysis start date and an analysis end date. Likewise, you will be prompted for your Joint Typhoon Warning Center (JTWC) website credentials. Hitting enter for JTWC login and password still allows SIFT to run, however there will be no storm predictions available alongside the CYGNSS satellite projections. In order to create a JTWC account please contact:
System Administrator, Joint Typhoon Warning Center (JTWC)
angelo.alvarez@navy.mil (NIPR)
808.471.3645
Director, Joint Typhoon Warning Center (JTWC)
robert.falvey@navy.mil
After creating an account, SIFT is able to access to storm forecast information from NOAA. Upon successful authentication, SpOCK begins the necessary propagation for the specified analysis interval.
input_sift/. If there was a problem during execution and certain SpOCK output files are not available on your local machine, you need to delete the appropriate folder in input_sift/ in order to force SpOCK to re-run.
Data Sources
SIFT relies on the following sources of information:
- SpOCK - propagator for all satellite information and specular point positions
- NOAA Storm Tracks - for all Atlantic Basin storm forecasts
- JTWC Storm Tracks - for all other storm forecasts
- NORAD TLEs - for GPS satellite TLEs
- SpaceTrack TLEs - for CYGNSS TLEs
Using SIFT
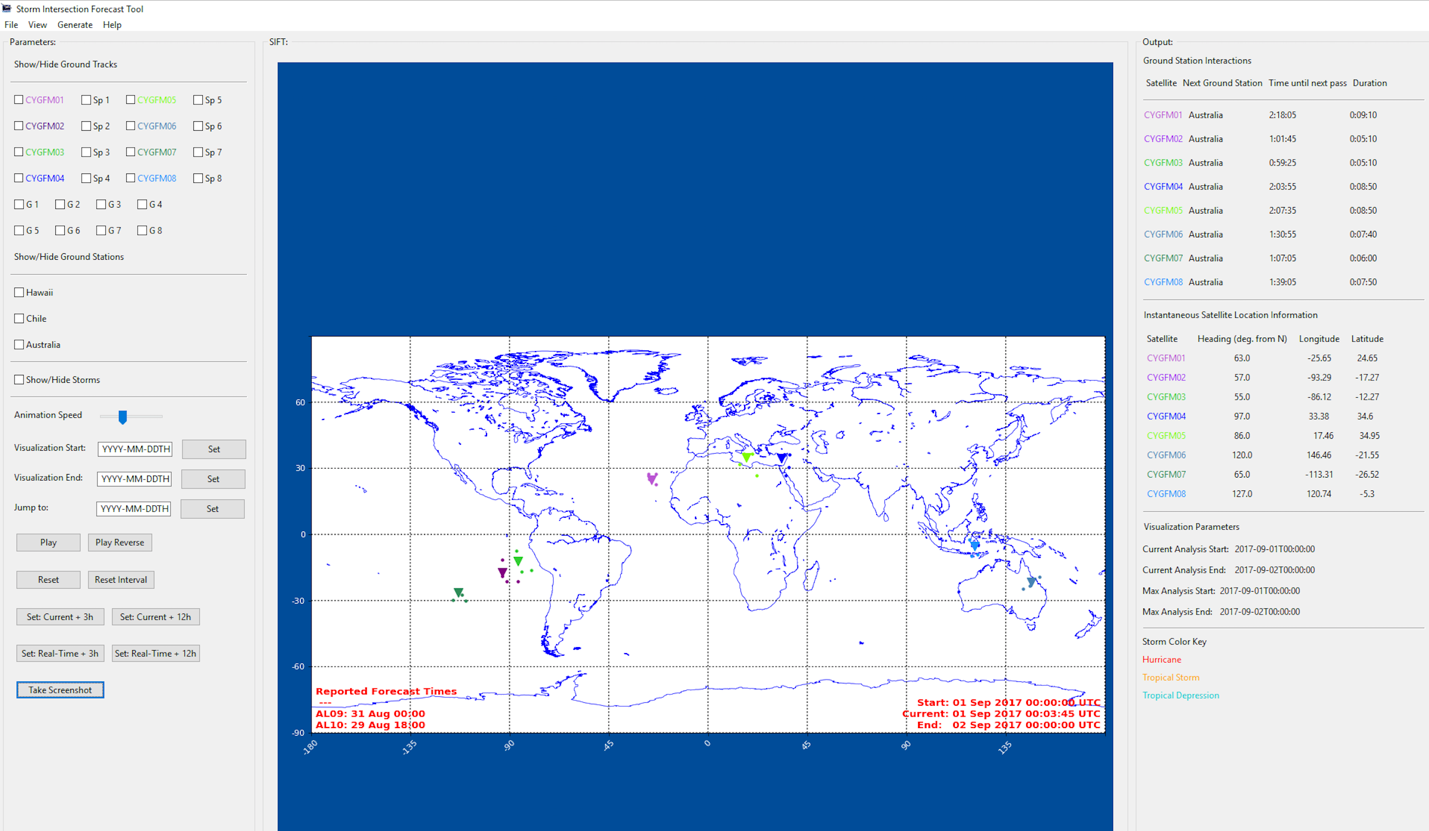
Inputs Section
The leftmost column of the main SIFT screen constitutes the 'inputs' section of the application. In this section various components can be added to the main visualization such as sub-satellite traces, specular point traces, ground elevation masks and storm forecast trajectories. This section also contains the main controls for operating SIFT i.e. play, pause, etc.
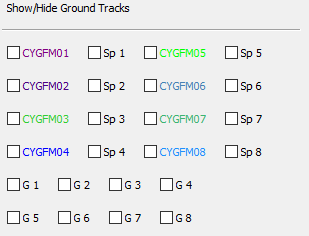
At the top of the inputs section ground tracks and specular point tracks for each satellite can be toggled on/off individually. Additionally, there are toggle boxes for a special version of specular point tracks which show specular point gain as line thickness.
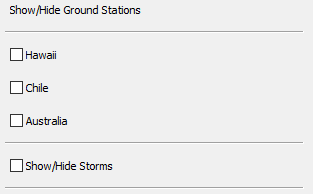
Below the 'Show/Hide Ground Tracks' section are the 'Show/Hide Ground Stations' controls. Here users can select which ground station 5 degree elevation masks they wish to see projected on the main display. Users can also select to display interpolated storm forecast tracks here as well, which will appear as long as there is a storm forecast within the analysis interval.
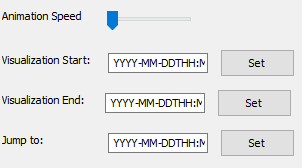
Next in the input section are the 'Visualization' controls. These options allow the user to speed up or slow down the animation speed, change the beginning/end points of the analysis interval, and jump to a time anywhere in between those beginning/end points. The appropriate format for all three visualization time text fields is 'YYYY-MM-DDTHH:MM:SS'.
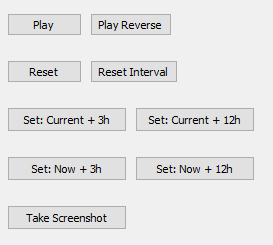
At the bottom of the Inputs section are additional visualization controls as well as analysis interval hot buttons, useful for quickly setting the analysis beginning/end times on the fly:
- Play/Pause - starts/pauses the animation
- Play/Reverse - plays the animation backwards
- Reset - sets the analysis time and satellite positions back to beginning of analysis interval
- Reset Interval - sets analysis interval to maxima determined at SIFT startup
- Current + 3h - sets analysis interval to current analysis time - current analysis time + 3h
- Current + 12h - same as above but + 12h
- Now + 3h - sets analysis interval to real-time - real-time + 3h
- Now + 12h - sets analysis interval to real-time - real-time + 12h
- Take Screenshot - stores screenshot in
output_sift/<run_dir>/screenshots/
Visualization Section
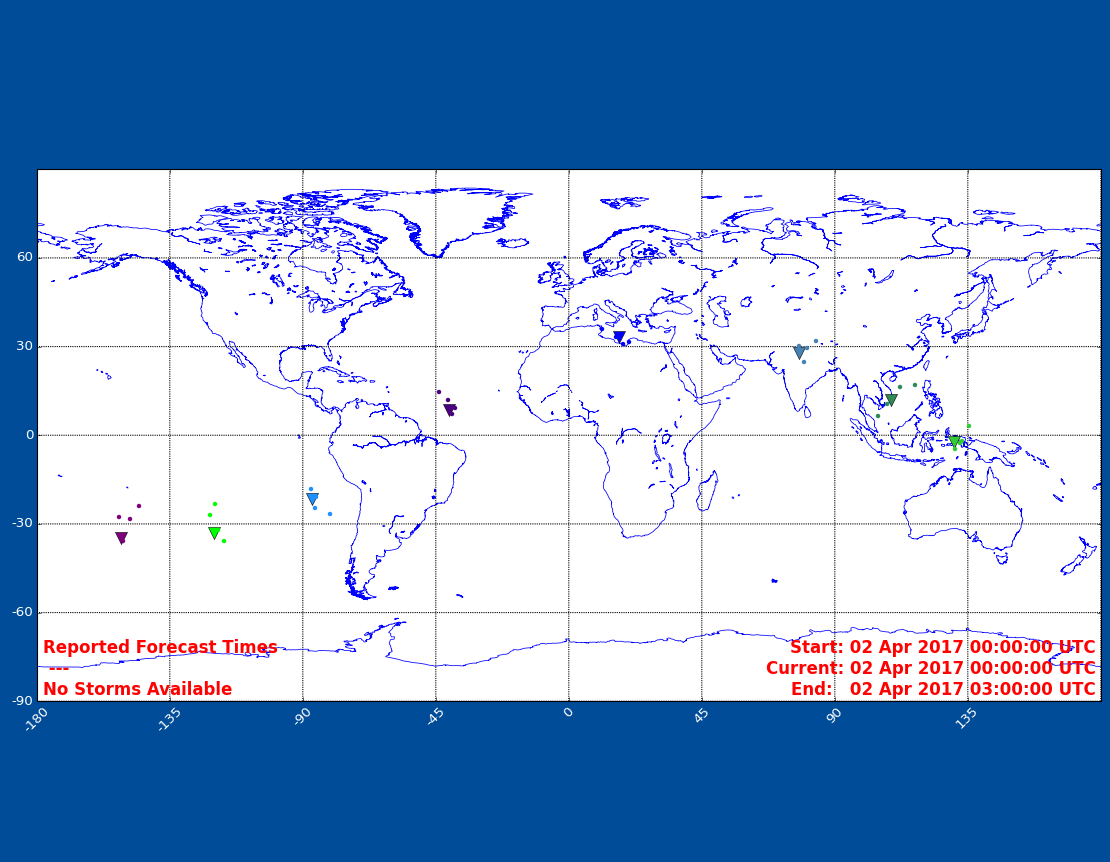
The center column of the main SIFT screen is the 'visualization' section of the application. This section is a map that displays all CYGNSS satellite and specular point locations, information about the analysis interval as well as a list of storms that exist in the current analysis interval.
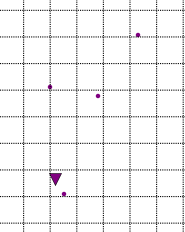
Shown above is a zoomed in image of one of the satellites shown in the 'visualization' section. The satellite location at a given moment in time is represented by the inverted triangle icon. Associated with the inverted triangle are four small circles of the same color - these circles represent the specular point measurements being made by the associated satelite.
- Changes have been made to SpOCK to improve the speed, performance and accuracy of SIFT.
- The colors of the CYGNSS satellites have been changed to help distinguish each satellite from each other.
- The overpass report has been modified in 3 ways:
- the column that shows the PRN of the specular point (NUM_PRN) has been kept but the column with the name of the GPS (NAME_GPS) has been removed;
- if the gain of the specular point is 0, the column GAIN shows ‘0’ (it used to show ‘LOW’). From 1 to 4 it shows ‘LOW’, 5 to 9 ‘MEDIUM', and 10 to 15 ‘HIGH’; and
- the number of decimals has been reduced: 3 for the longitude and latitude, 1 for the heading.
Outputs Section
The rightmost column of the main SIFT screen is the 'outputs' section of the application. It shows information about the next ground station overpass for each satellite as well as satellite headings and information about how to read information encoded in the visualization section (i.e. specular point gain, storm trajectory and type, etc.).
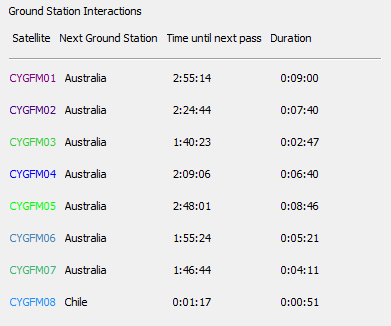
The topmost area of the 'outputs' section shows upcoming ground station interactions for all satellites provided there will be an interaction before the end of the analysis interval. Each line represents one satellite and the satellites are color-coded to match the satellites icons in the visualization section. Information provided includes the next ground station the satellite will pass over, how long until that overpass occurs and how long that overpass will last for.
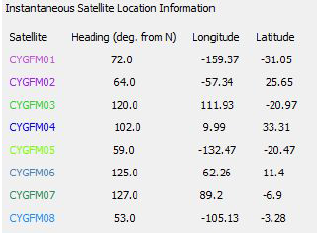
Below the ground station interactions portion of the output GUI is the Instantaneous Satellite Location Information. In the section the current timestep by timestep location and heading of each individual CYGNSS satellite can be seen.
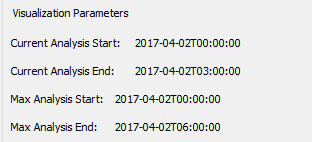
The middle area of the 'outputs' section shows information about the current analysis interval and the maximum analysis interval defined at SIFT start up.
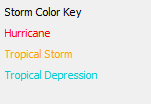
At the bottom of the 'outputs' section is a simple storm color code reference, showing a different color for each of three major storm types of interest. An expanded key is available in the SIFT toolbar described below.
Application Toolbar Options
At the top of the main SIFT window there are four drop down menus: File, View, Generate and Help. The File menu contains additional application operations functions, such as a button to close the application. View offers various zoom options for the visualization pane of the application, allowing users to change the map area of focus.
In addition to the several zoom presets, users can specify their own zoom settings by editing input_sift/user_zoom.txt.
Values entered in user_zoom.txt must be whole numbers with latitude in +/-deg N 0-90, and longitude in +/-deg E, 0-180. (The first three lines of this file are ignored).
zoom_settings.txt in the SIFT root directory.
Generate offers several reports which can be generated by SIFT. Reports are stored in the appropriate subdirectory of output_sift/:
- Satellite/Ground Station Report - a report designed to provide users with a quick overview of when ground station overpasses will occur on a per satellite basis
- Overpass Report - a report designed to report specular point samples within any specified lat/lon grid and time window. The header of the CSV file produced is:
CYGFM0#,TIME,LAT_SPEC,LON_SPEC,HEADING,GAIN,NUM_PRN,SCIENCE_MODE_Y/N
GAIN column is in terms of '0, LOW, MEDIUM, HIGH'.
Help provides expanded functionality or additional information about items available on the GUI. The Help menu is where users will find an expanded color key for all storm types forecasted by NOAA and the JTWC.
SIFT Log
In addition to the various on-screen inputs/outputs described above there is a sift.log file located in the SIFT root directory. The purpose of this file is to capture SIFT events while the software is executing. Events are logged at one of five levels, namely info, debug, warning, error, critical shown here in increasing order of severity. The log file can be used to review SIFT regular use errors (i.e. if an analysis time is requested that is outside the analysis interval for that SIFT run an event will be logged) as well as SpOCK execution issues. All standard error output is written to the log file in the case of a crash allowing users to easily retrieve error codes and information for bug report submission.
Appendix I: Full listing of information encoding SIFT
The following information encodings in SIFT are listed in the format: graphical attribute - physical quantity or significance.
Satellite/Specular Points
Icon Color (inverted triangle for satellites, small circle for specular points) - associated satellite number
Line Thickness (when plotting specular gain) - specular gain, consult Gain key (under Help > Specular Gain Trace Key)
Storms
Circle Size - storm size, calculated as circle of radius maximum 34kt winds
Circle Color - storm type, consult Color key (under Help > Storm Forecast Color Key)
Circle Color (darkened) - indicates current storm position
Circle Color (lightened) - indicates future forecasted position
Appendix II: Python packages required for SIFT
- wxPython
- calendar
- numpy
- getpass
- sys
- os
- glob
- datetime
- time
- fileinput
- setuptools
- subprocess
- matplotlib
- mpl_toolkits.basemap
- name_package
- collections
- itertools
- operator
- math
- scipy
- bisect
- logging
- ctypes
- pprint
- pandas
- ssl
- urllib
- urllib2
- base64
- bs4
- re
- request