Overview
This page includes the most recent information on CYGNSS orbits.
Current satellite and wind measurement locations - Animation
The first animation shows the positions for each CYGNSS over the current orbit (updated hourly).
The second animation shows the locations of the specular points, where the CYGNSS measure the surface wind speeds (updated hourly).
Daily Orbit Status
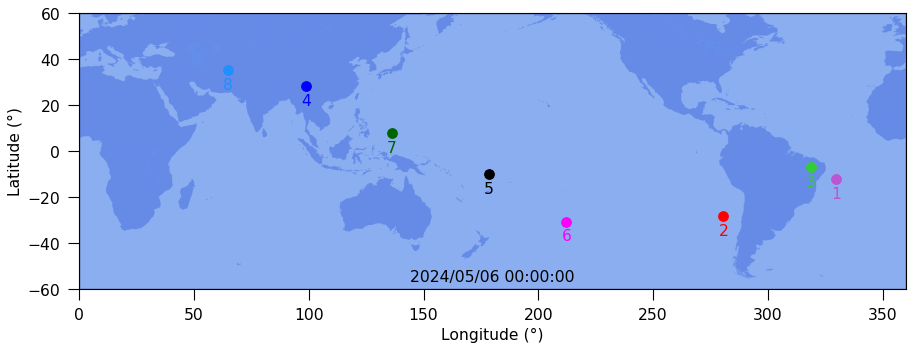
Figure 1 represents a snapshot of the CYGNSS satellites. It shows the relative positions of the observatories along the orbit.
The table (bottom left) shows orbit parameters of each CYGNSS orbit: perigee, apogee, spacing (as a time, distance, and angular separation) and phase rate difference with respect to FM03.
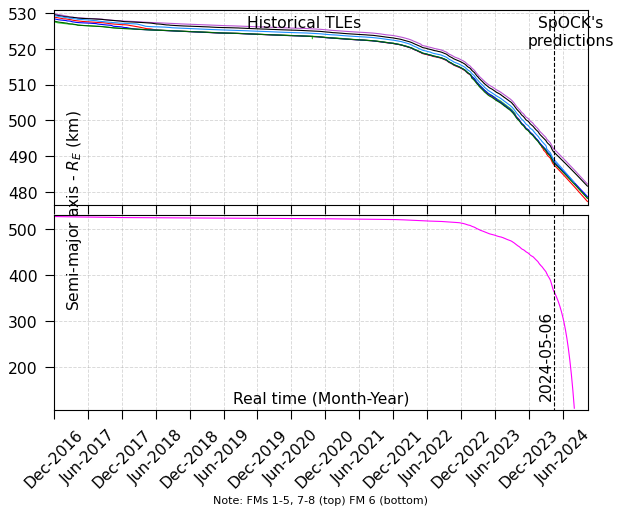
Figure 2 shows the altitudes the CYGNSS satellites from launch until the current day (left part of the plot, labeled as "Historical TLEs"), and altitude predictions by SpOCK for the next 6 months, assuming the satellites to be nadir pointing (solid lines) or pitched into a high drag configuration (dashed lines) (right part of the plot, labeled as "SpOCK's predictions").
The two figures and the table are updated daily.
| 2026/07/17 00:00:00 | ||||||
|---|---|---|---|---|---|---|
| Observatory | Perigee (km) | Apogee (km) | Trailing/Leading Time (min) |
Distance (km) | Trailing/Leading Separation (°) |
Phase rate difference (°/day) |
| FM01 | 392.3 | 401.4 | 55.5/39.5 | 17692.4 | 210/150 | 2.926 |
| FM02 | 361.9 | 385.9 | 6.9/88.1 | 3080.0 | 26/334 | 1.712 |
| FM03 | 373.9 | 396.1 | 0.0/95.0 | 0.0 | 0/360 | 0 |
| FM04 | 369.8 | 391.4 | 0.1/94.9 | 59.0 | 1/359 | 5.154 |
| FM05 | 383.8 | 405.6 | 92.2/2.8 | 1256.4 | 349/11 | 0.554 |
| FM07 | 378.8 | 388.1 | 42.7/52.3 | 19117.5 | 162/198 | 0.036 |
| FM08 | 376.7 | 402.1 | 11.4/83.6 | 5105.6 | 43/317 | 0.34 |